Plot heatmap of the sample scores
sampleScoreHeatmap(
  score,
  dataName,
  modelName,
  cluster_rows = TRUE,
  cluster_columns = TRUE,
  show_row_names = TRUE,
  show_column_names = TRUE,
  row_names_gp = 0.7,
  column_names_gp = 5,
  ...
)
Arguments
- score
An output from
calculateScorefunction, which is a matrix with samples (row) and PrcompClusters (column) If it is a simple vector, it will be converted to a one-column matrix.- dataName
Title on the row. The name of the dataset to be scored.
- modelName
Title on the column. The RAVmodel used for scoring.
- cluster_rows
A logical. Under the default (
TRUE), rows will be clustered.- cluster_columns
A logical. Under the default (
TRUE), columns will be clustered.- show_row_names
Whether show row names. Default is
TRUE, showing the row name.- show_column_names
Whether show column names. Default is
TRUE, showing the column name.- row_names_gp
Graphic parameters for row names. The default is 0.7.
- column_names_gp
Graphic parameters for column names. The default is 5.
- ...
Any additional argument for
Heatmap
Value
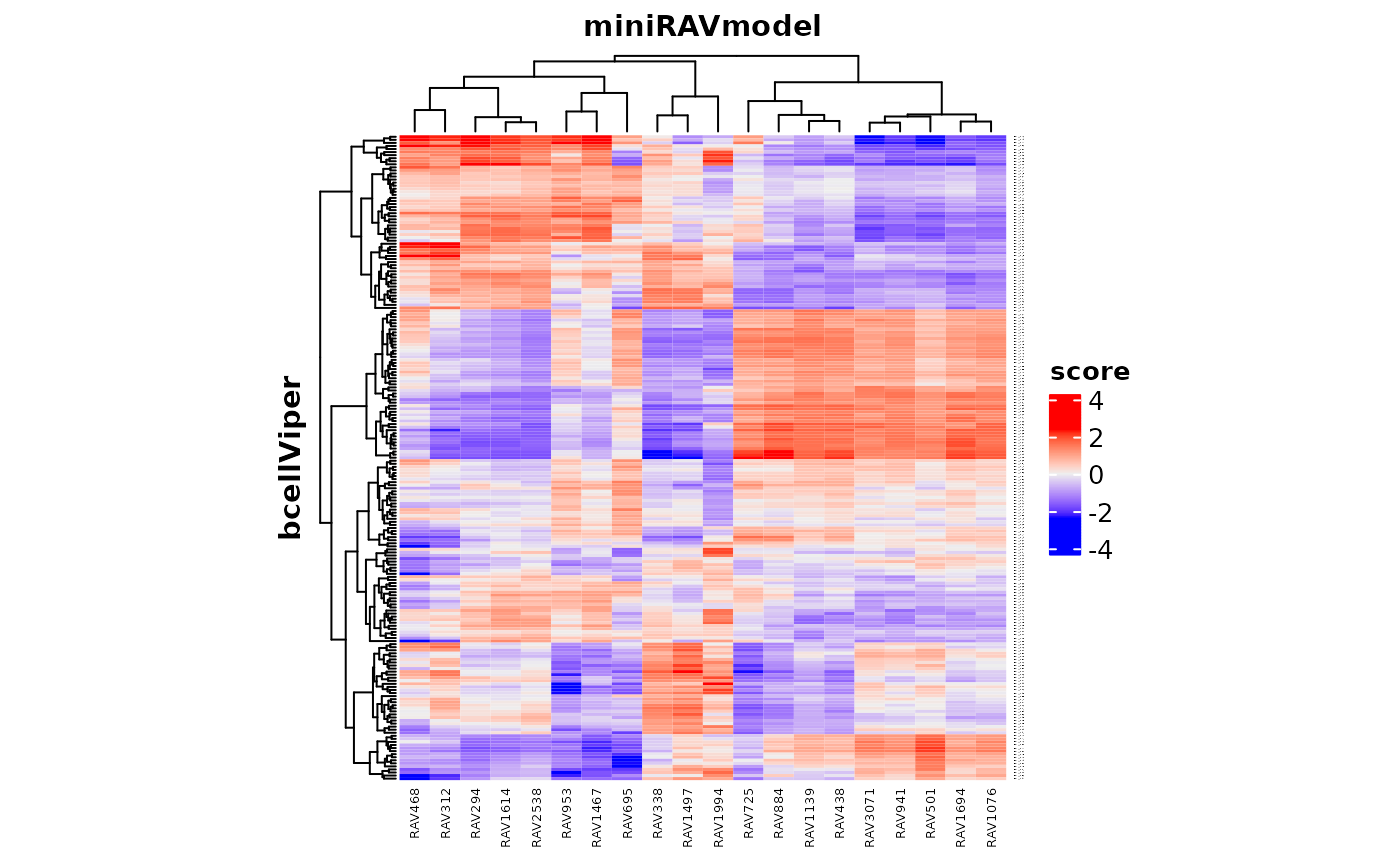
A heatmap of the sample score. Rows represent samples and columns represent RAVs.
Examples
data(miniRAVmodel)
library(bcellViper)
data(bcellViper)
score <- calculateScore(dset, miniRAVmodel)
sampleScoreHeatmap(score, dataName="bcellViper", modelName="miniRAVmodel")