Here, we presents the usecases and benchmarking examples of GenomicSuperSignature R/Bioconductor package. More description on these examples can be found in the manuscript.
Disease Subtyping
To compare the utility of GenomicSuperSignature relative to the focused use of data from a single disease, we compared RAVs to the previous study (referred as CRC paper below) that employed colorectal cancer (CRC) gene expression databases to identify CRC molecular subtypes.
Continuous Subtype Score
The left panel is Figure 4A from CRC paper and the right panel is the CRC subtype separation by GenomicSuperSignature. CRC paper built the continuous score model based on the 8 colorectal cancer specific, microarray datasets with graph-based clustering method. GenomicSuperSignature was generated from 536 heterogeneous, RNA sequencing datasets and used hierarchical clustering. Despite of these major differences in model building process, GenomicSuperSignature and CRC paper’s model show comparable performance.
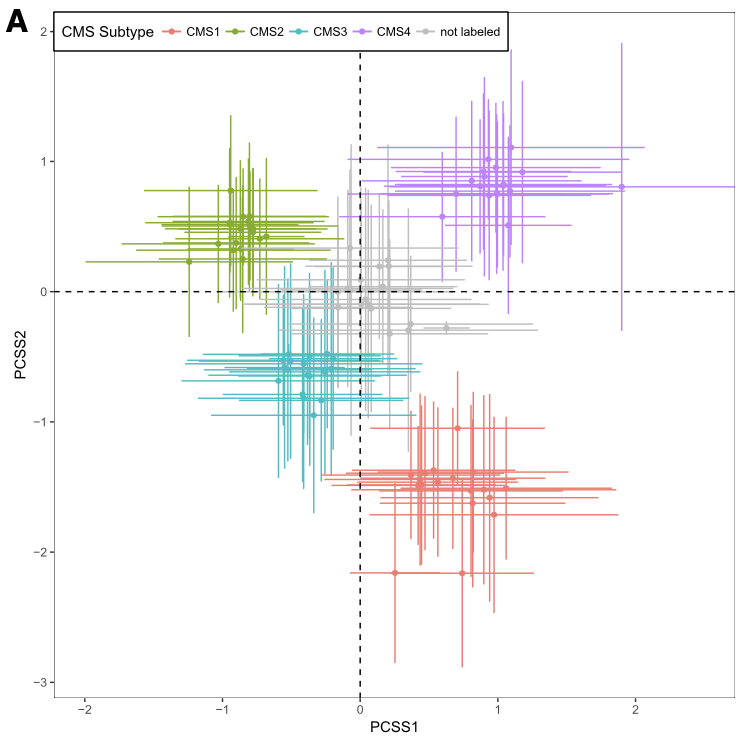
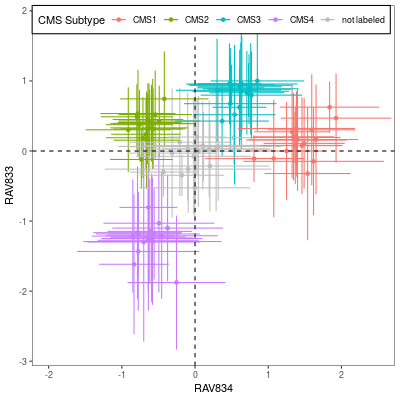
Details on these plots are described in Subtyping/CRC subtype scores.
Clinical Variables
Below is Figure 4 from CRC paper. LRT (likelihood-ratio test) between the reference full model versus either the continuous scores only model or the discrete subtypes only model are plotted here. A p-value near 1 (−log10p-value near 0) suggests that no additional information is provided by the full model.
This results shows that PCSS1/2 (the second column, score) provide additional information in characterizing molecular/histological/clinical correlates than CMS (the first column, subtype).
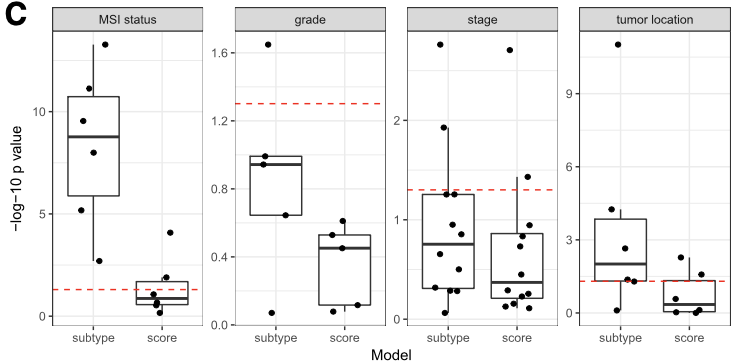
RAV834/833, two RAVs that explain CMS subtypes best among 4,764 RAVs, also performs better than CMS subtypes.
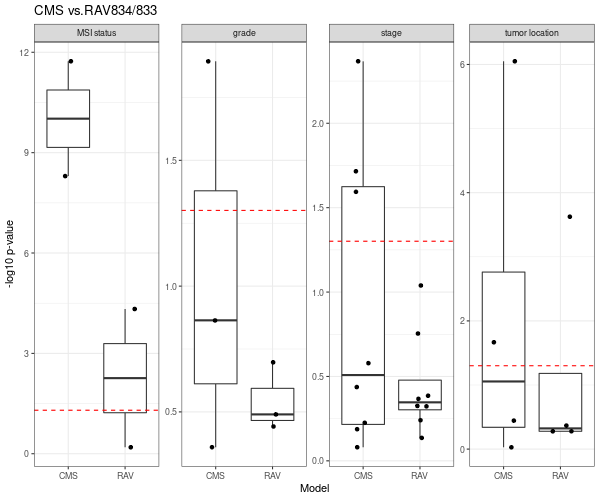
We directly compared the performance between PCSSs and RAVs. Except the tumor location (the last panel), RAV834/833-based model out-performed PCSS1/2-based model relative to the combined model.
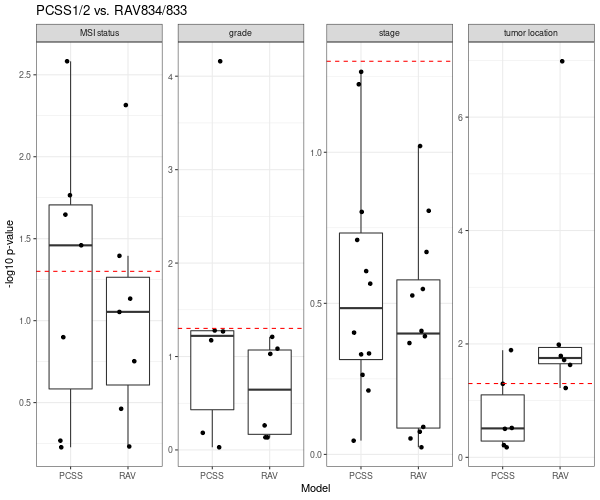
Details on the above plots are described in Subtyping/CRC clinical variables.
Transfer Learning
For practical and technical reasons, biological datasets often contain missing information or signals buried in noise. GenomicSuperSignature can fill out those gaps by uncovering weak or indirectly measured biological attributes of a new dataset by leveraging the existing databases. To evaluate this ‘transfer learning’ aspect of the GenomicSuperSignature, we compared the neutrophil count estimation by RAVs across two different datasets, systemic lupus erythematosus whole blood (SLE-WB) and nasal brushing (NARES) datasets as described in the previous study(referred as MultiPLIER paper below).
Neutrophil Counts/Estimates
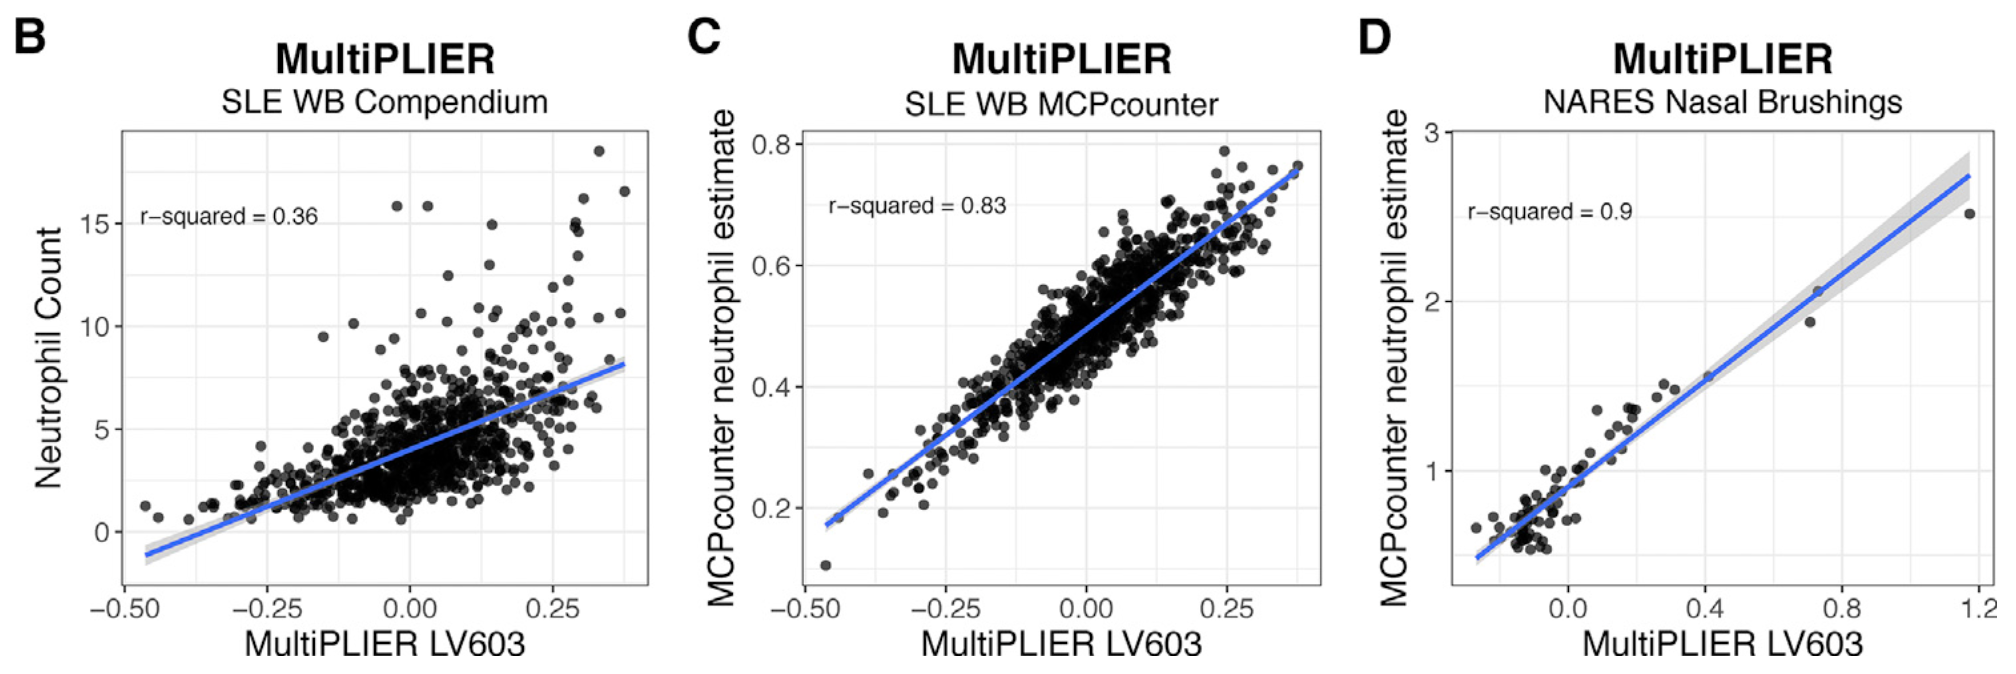
The top panel is Figure 3 from MultiPLIER paper and the bottom panel is the result from GenomicSuperSignature. In MultiPLIER paper, latent variables (LVs) were built from recount2 datasets using Pathway-level information extractor (PLIER) method. Despite of the major differences in model building process, GenomicSuperSignature and MultiPLIER paper’s results show comparable performance.
Neutrophil-associated LV, LV603, from MultiPLIER model shows the positive correlation with neutrophil counts/estimates of two different datasets, SLE-WB and NARES.
We used SLE-WB dataset to identify the neutrophil-associated RAV, RAV1551, and applied it to NARES dataset.
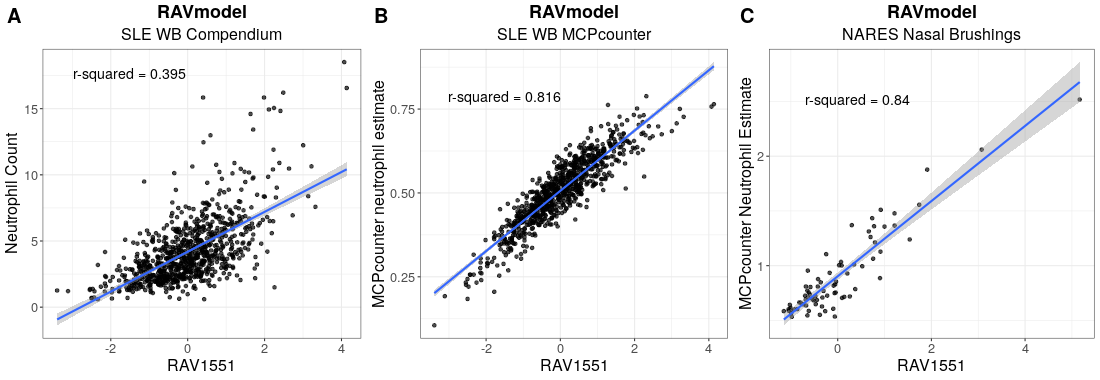
Details on the analysis process are described in Transfer Learning/Neutrophil (SLE-WB) and Transfer Learning/Neutrophil (NARES).